


Mekari Highlight
- Enterprise reporting in BI is the structured and governed practice of consolidating business data into standardized reports, dashboards, and KPI views.
- Agentic AI can help organizations move from understanding what happened to determining what to do next by identifying anomalies, explaining KPI movements, and suggesting potential actions.
- Mekari Airene helps businesses turn governed business data into actionable insights by analyzing data and generating summaries, descriptive insights, and actionable recommendations.
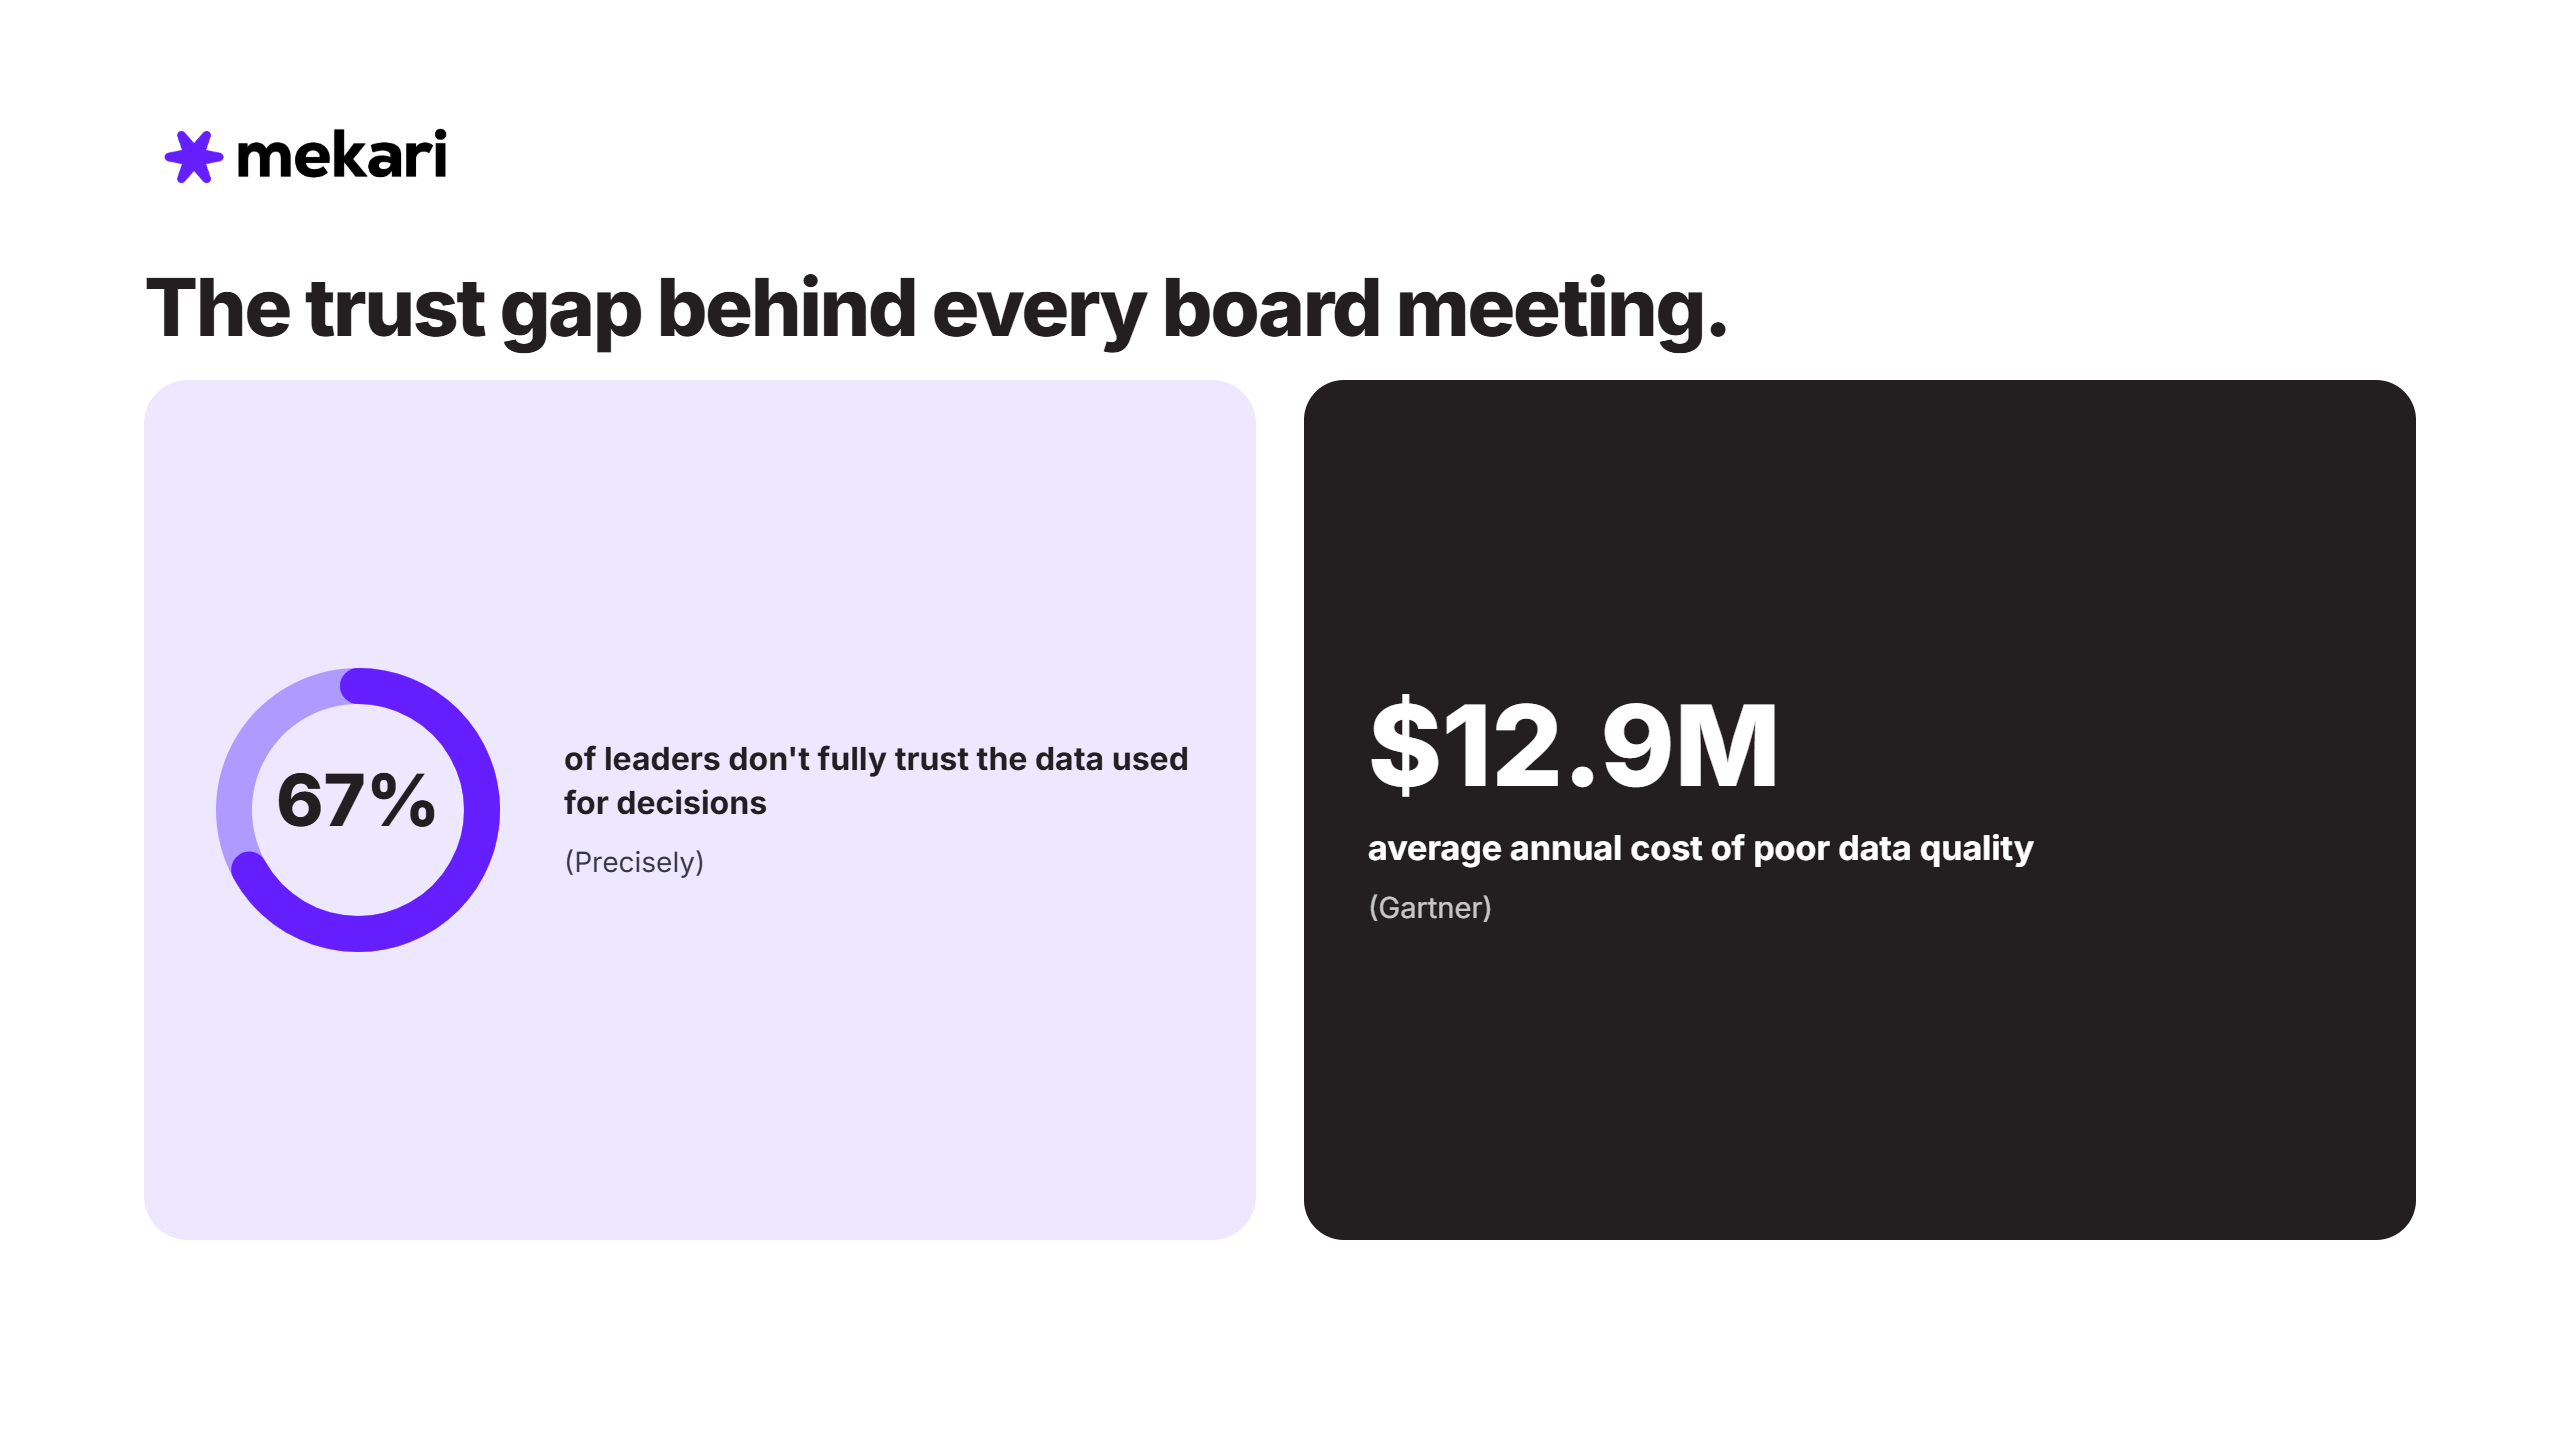
Ask any CFO what’s wrong with their board meetings, and the answer tends to be the same: the first 30 minutes are spent reconciling numbers, not making decisions. Finance reports one revenue figure, sales reports another, operations has a third.
This is the problem enterprise reporting in business intelligence is designed to address, creating one governed view of cross-functional performance that stakeholders can consistently trust.
This article explores what enterprise reporting means, how it differs from general BI, why many enterprise reporting initiatives fail, and how agentic AI is expanding what reporting can do.
Enterprise Reporting Business Intelligence
Enterprise reporting and business intelligence (BI) is the processes and technologies organizations use to collect, organize, analyze, and present business data, enabling teams to monitor performance and make informed decisions.
The distinction from general business intelligence is important. BI is primarily exploratory: analysts use it to investigate root causes, identify trends, and answer ad hoc business questions.
On the other hand, enterprise reporting is governed and distributed, providing standardized and certified KPIs to broader audiences according to an established reporting cadence.
Why Enterprise Reporting Matters
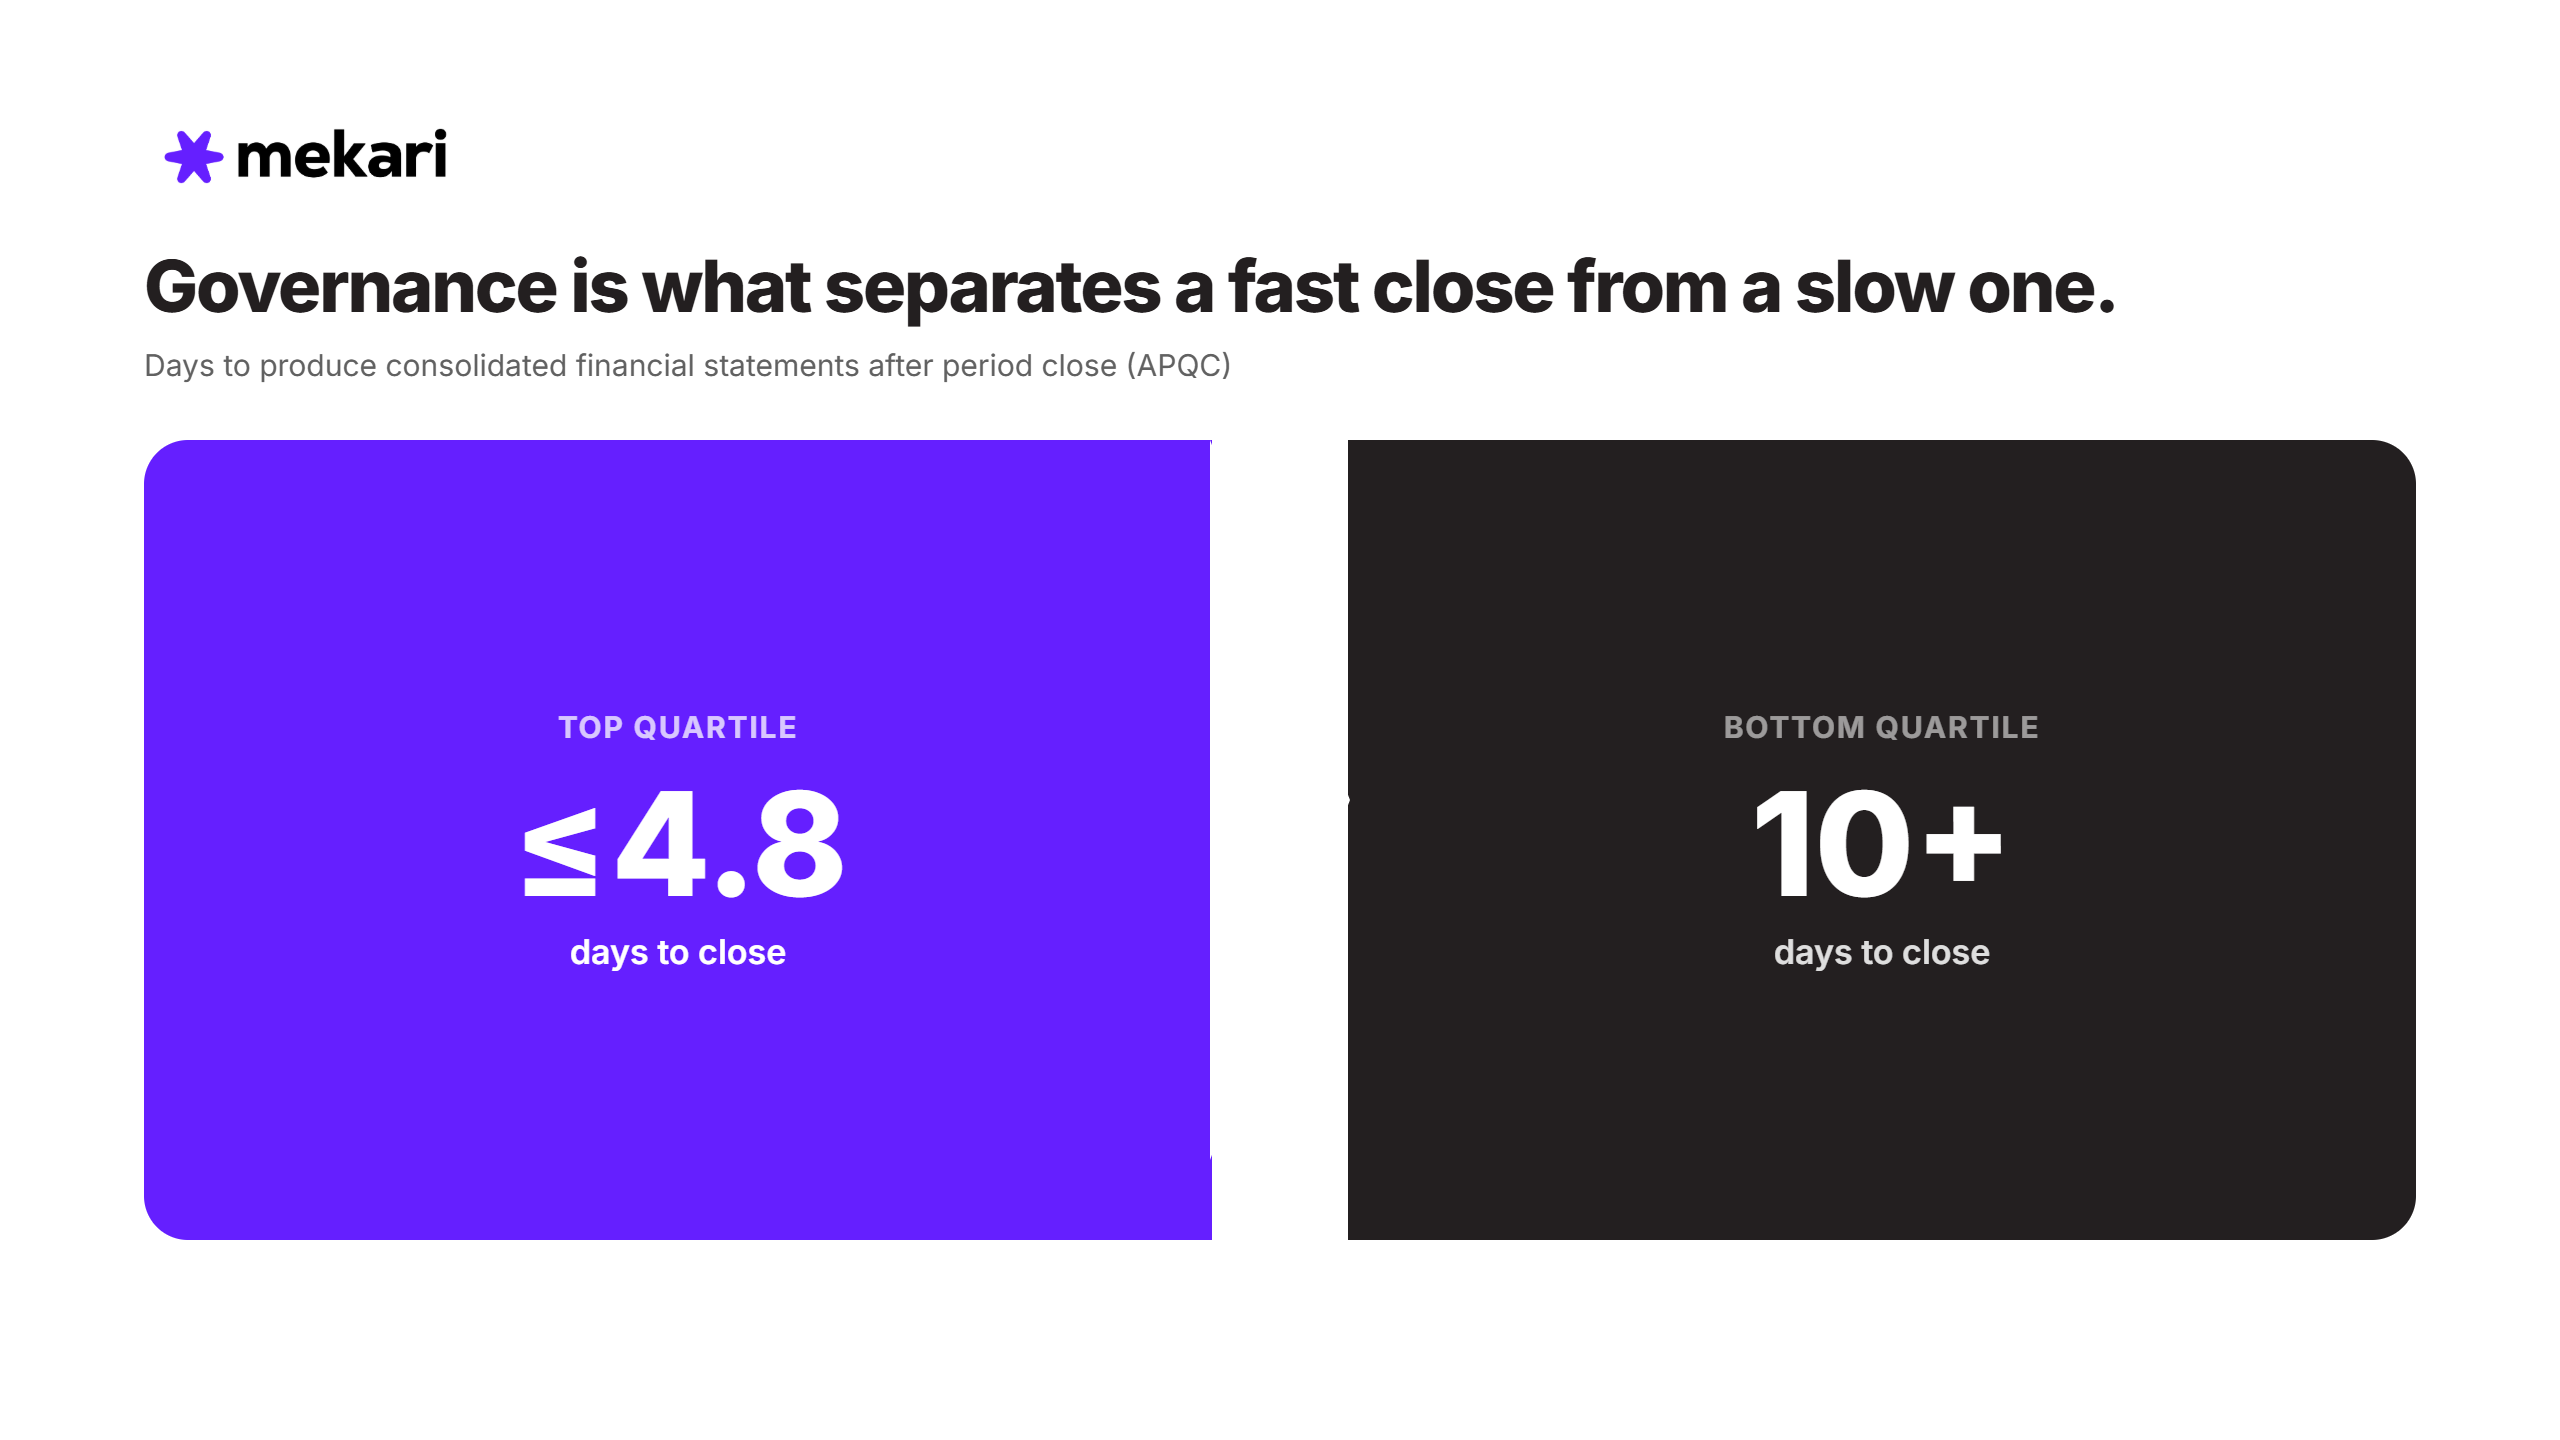
The difference between organizations with disciplined reporting governance and those without it becomes particularly visible in how quickly they can act on financial information.
The gap is not a headcount gap. It’s an integration and governance gap. Organizations that have unified their reporting across HR, finance, and operations don’t spend the first week of the month waiting for each function to manually reconcile its own numbers.
The close simply runs faster because the data is already in one place.
How Enterprise Reporting Works: The Architecture That Creates Trust
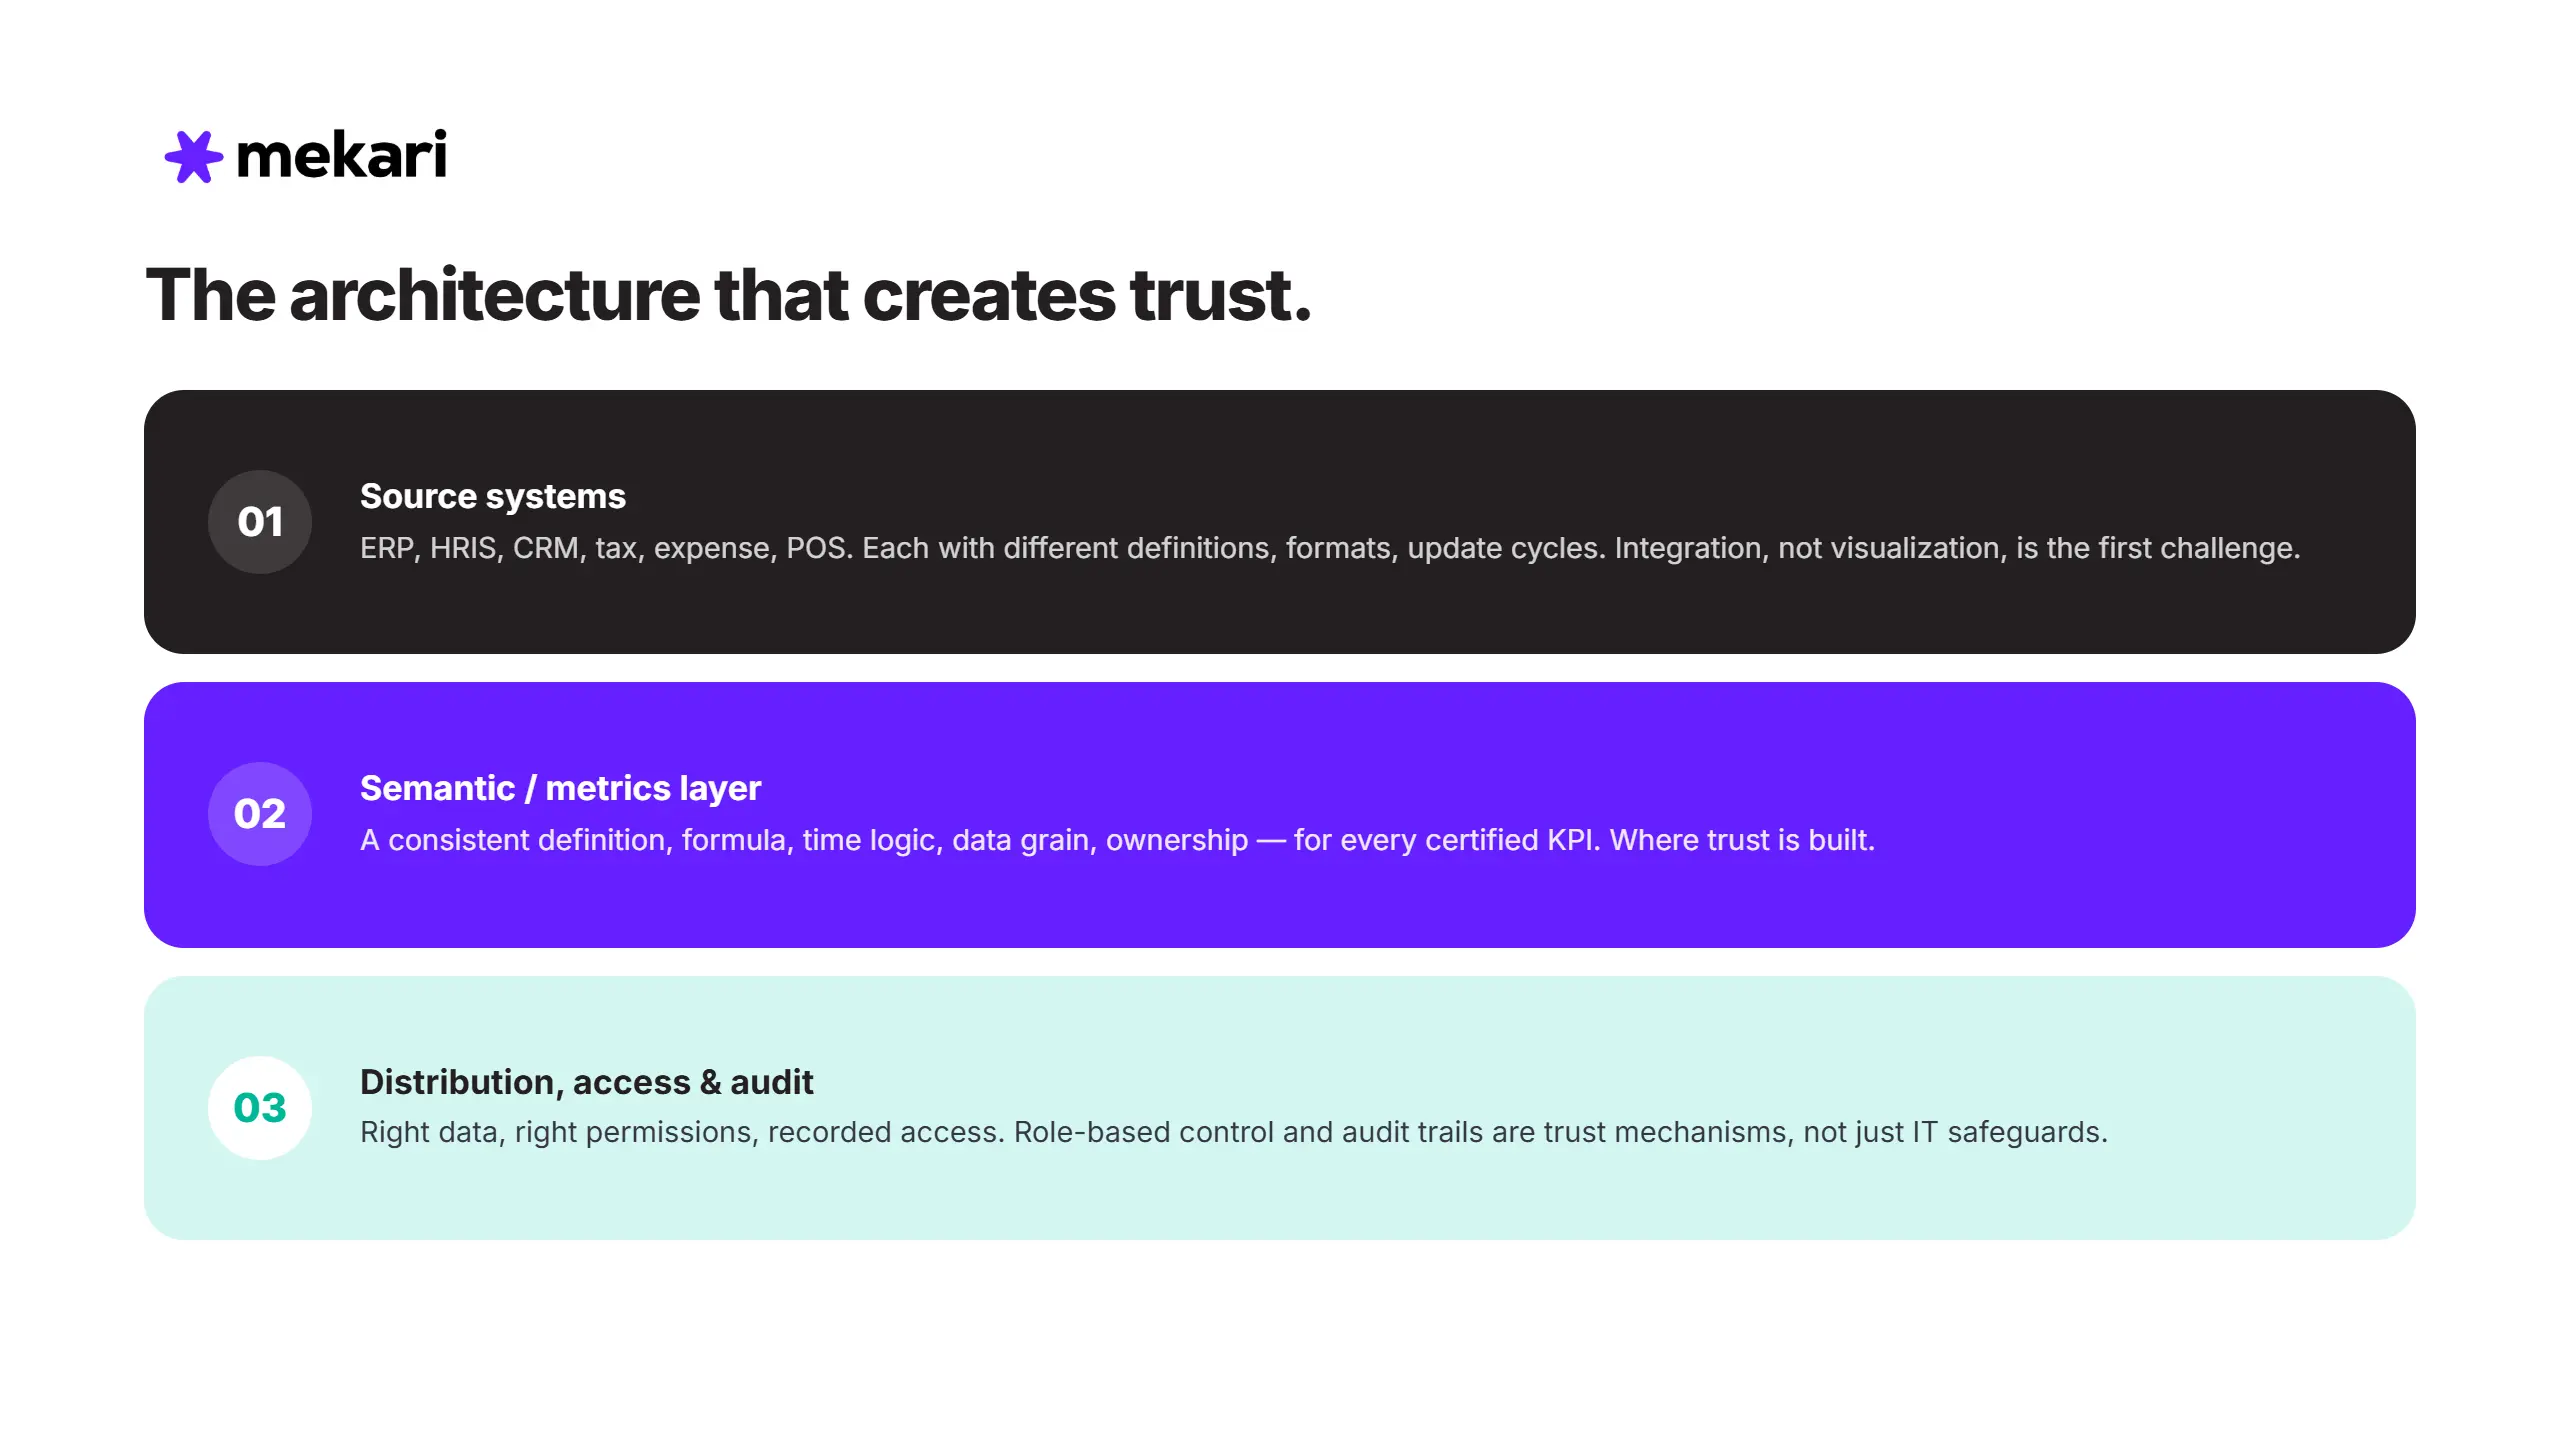
1. Source systems and the integration challenge
Enterprise data originates across multiple operational systems, including ERP, HRIS, CRM, tax platforms, expense management tools, and POS systems. Each system may use different data definitions, formats, and update cycles.
This makes enterprise data integration, rather than visualization, the first major challenge in enterprise reporting.
A question as simple as “What is our revenue?” can require data from several systems across a large organization. Your team may need to reconcile different revenue definitions, reporting periods, currencies, and other data conventions before arriving at a single answer.
2. The semantic layer: where trust is built
A governed semantic or metrics layer is one of the most critical components of an enterprise reporting architecture. It establishes a consistent definition for every certified KPI, including its formula, time logic, data grain, and ownership.
Once revenue is defined at this layer, the metric should mean the same thing whether it appears on the CFO’s dashboard, a regional manager’s drill-down, or an AI-generated report.
Without this layer, organizations often encounter the same structural problem: different teams maintain their own definitions of the same metric, and those differences become visible whenever their reports are compared.
3. Distribution, access control, and audit trails
Enterprise reporting is only complete when users receive the right data, with the appropriate permissions, and with access activity properly recorded.
Role-based access control and row-level security should not be treated as simple IT safeguards. They are essential mechanisms for maintaining trust in enterprise reporting.
For regulated organizations, audit trails are also a compliance requirement. The CFO, for example, needs confidence that the figures presented in a board pack are based on the same underlying data available to auditors.
Three Types of Enterprise Reports
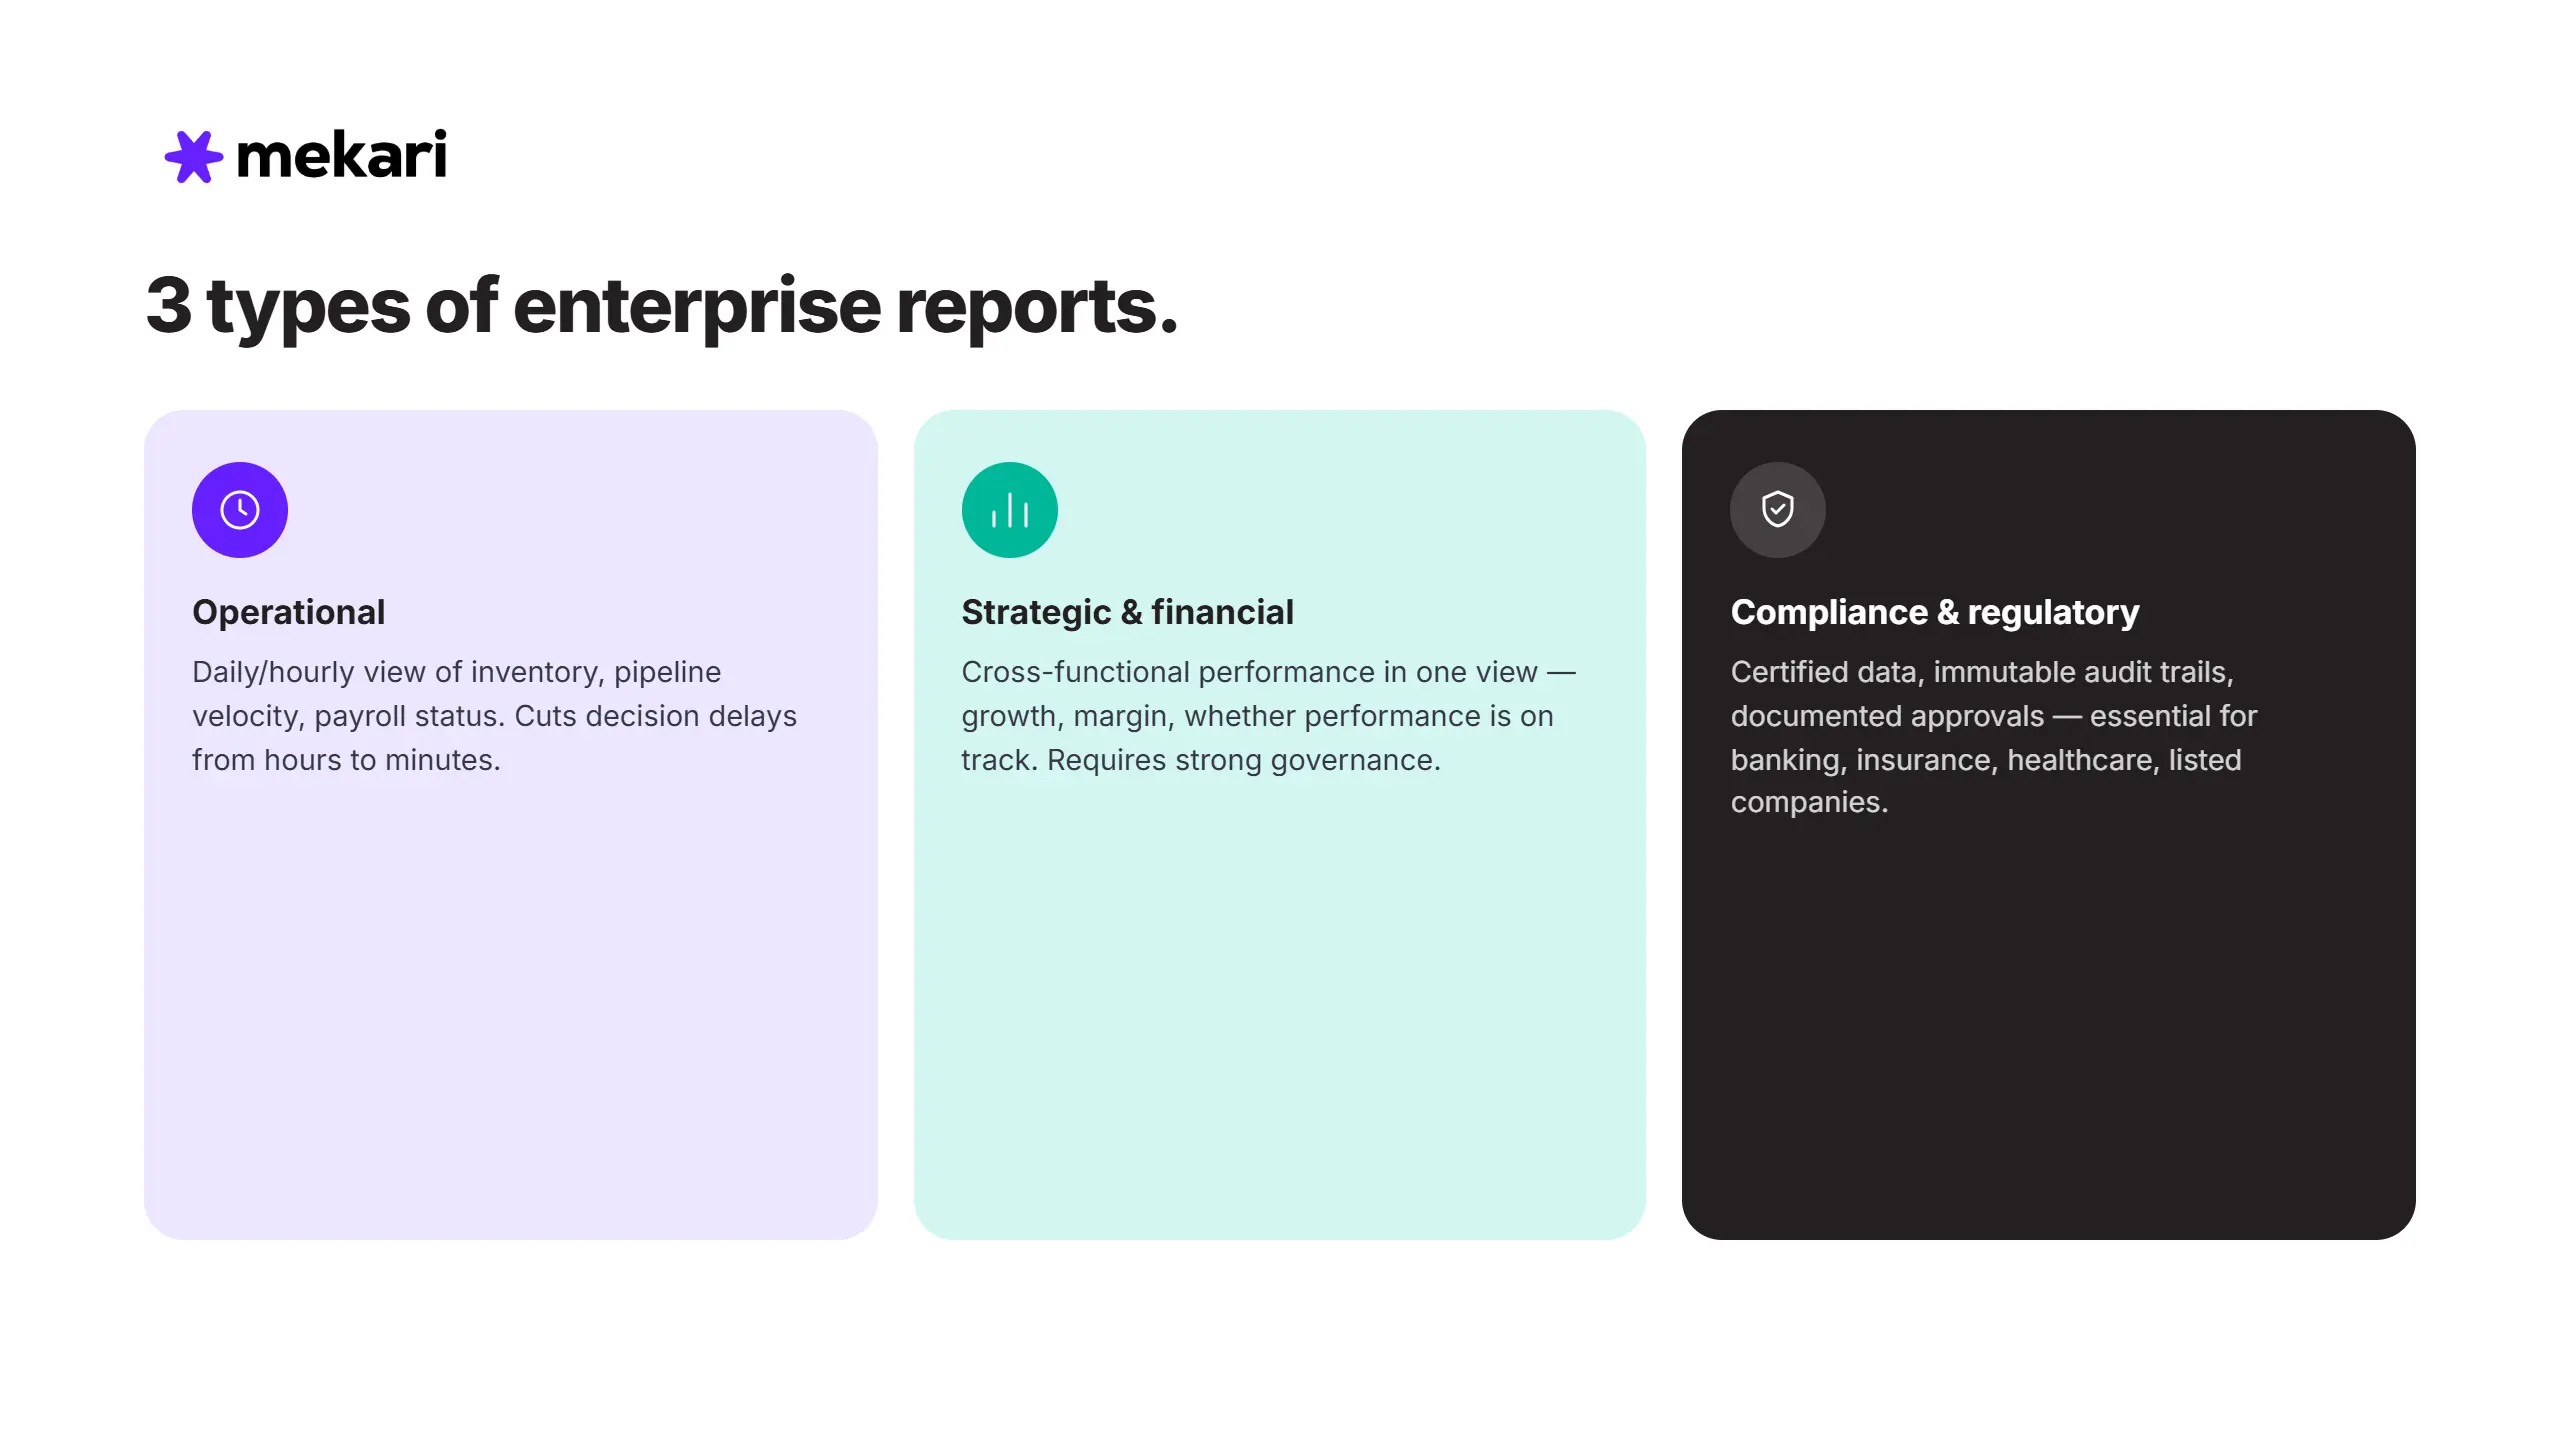
Enterprise reports generally fall into three categories, each designed to support a different type of business decision.
1. Operational reports
Operational reports provide daily or hourly visibility into tactical metrics such as inventory, sales pipeline velocity, payroll status, and service resolution times. With real-time data, organizations can reduce decision delays from hours to minutes.
2. Strategic and financial reports
Strategic and financial reports bring cross-functional performance into a single view, helping executives answer core questions such as whether the business is growing, margins are improving, and performance remains on track.
Because these reports directly inform high-impact decisions, they require strong governance and consistent KPI definitions.
3. Compliance and regulatory reports
Compliance and regulatory reports rely on certified data, immutable audit trails, and documented approval processes. For regulated organizations across banking, insurance, healthcare, and publicly listed companies, these controls are essential.
The underlying principle is similar to effective board reporting: one source of truth, clear ownership, and controlled changes to data and definitions.
Enterprise Reporting Meets Agentic AI: From Dashboards to Autonomous Insight
From descriptive to prescriptive
Traditional enterprise reporting focuses on what happened. Agentic AI moves reporting toward what should happen next by identifying anomalies, explaining KPI movements in natural language, supporting AI-driven forecasting, and recommending potential actions without requiring an analyst to interpret every result.
This shift changes how organizations should think about reporting infrastructure. Enterprise reporting platforms need to support not only today’s dashboards and reports, but also the progression toward AI-assisted and increasingly autonomous analytics.
The governance paradox
AI-generated insights are only as reliable as the data behind them. When an AI reporting layer relies on inconsistent or ungoverned source data, it can produce recommendations that sound convincing but are fundamentally wrong.
That makes the implementation sequence critical: governance first, AI second.
Deploying AI on top of fragmented reporting systems does not eliminate underlying inconsistencies. It can simply make them harder to identify.
Businesses moving toward AI-powered reporting should first establish a governed metrics layer, then use enterprise automation to distribute reports on schedule, and only afterward introduce AI-driven analysis.
What the right approach looks like
The stronger approach is to embed AI within an already governed data environment. AI should work from certified and consistently defined metrics, rather than raw or uncontrolled data feeds.
When the underlying data is governed, AI-generated insights have a stronger foundation for executive decision-making.
Without that foundation, AI may produce polished narratives and recommendations that look impressive but are difficult to trust or act upon.
The goal is therefore not simply to add AI to enterprise reporting. It is to build an environment where governed data enables AI to produce insights executives can confidently use.
Why Most Enterprise Reporting Programs Fail
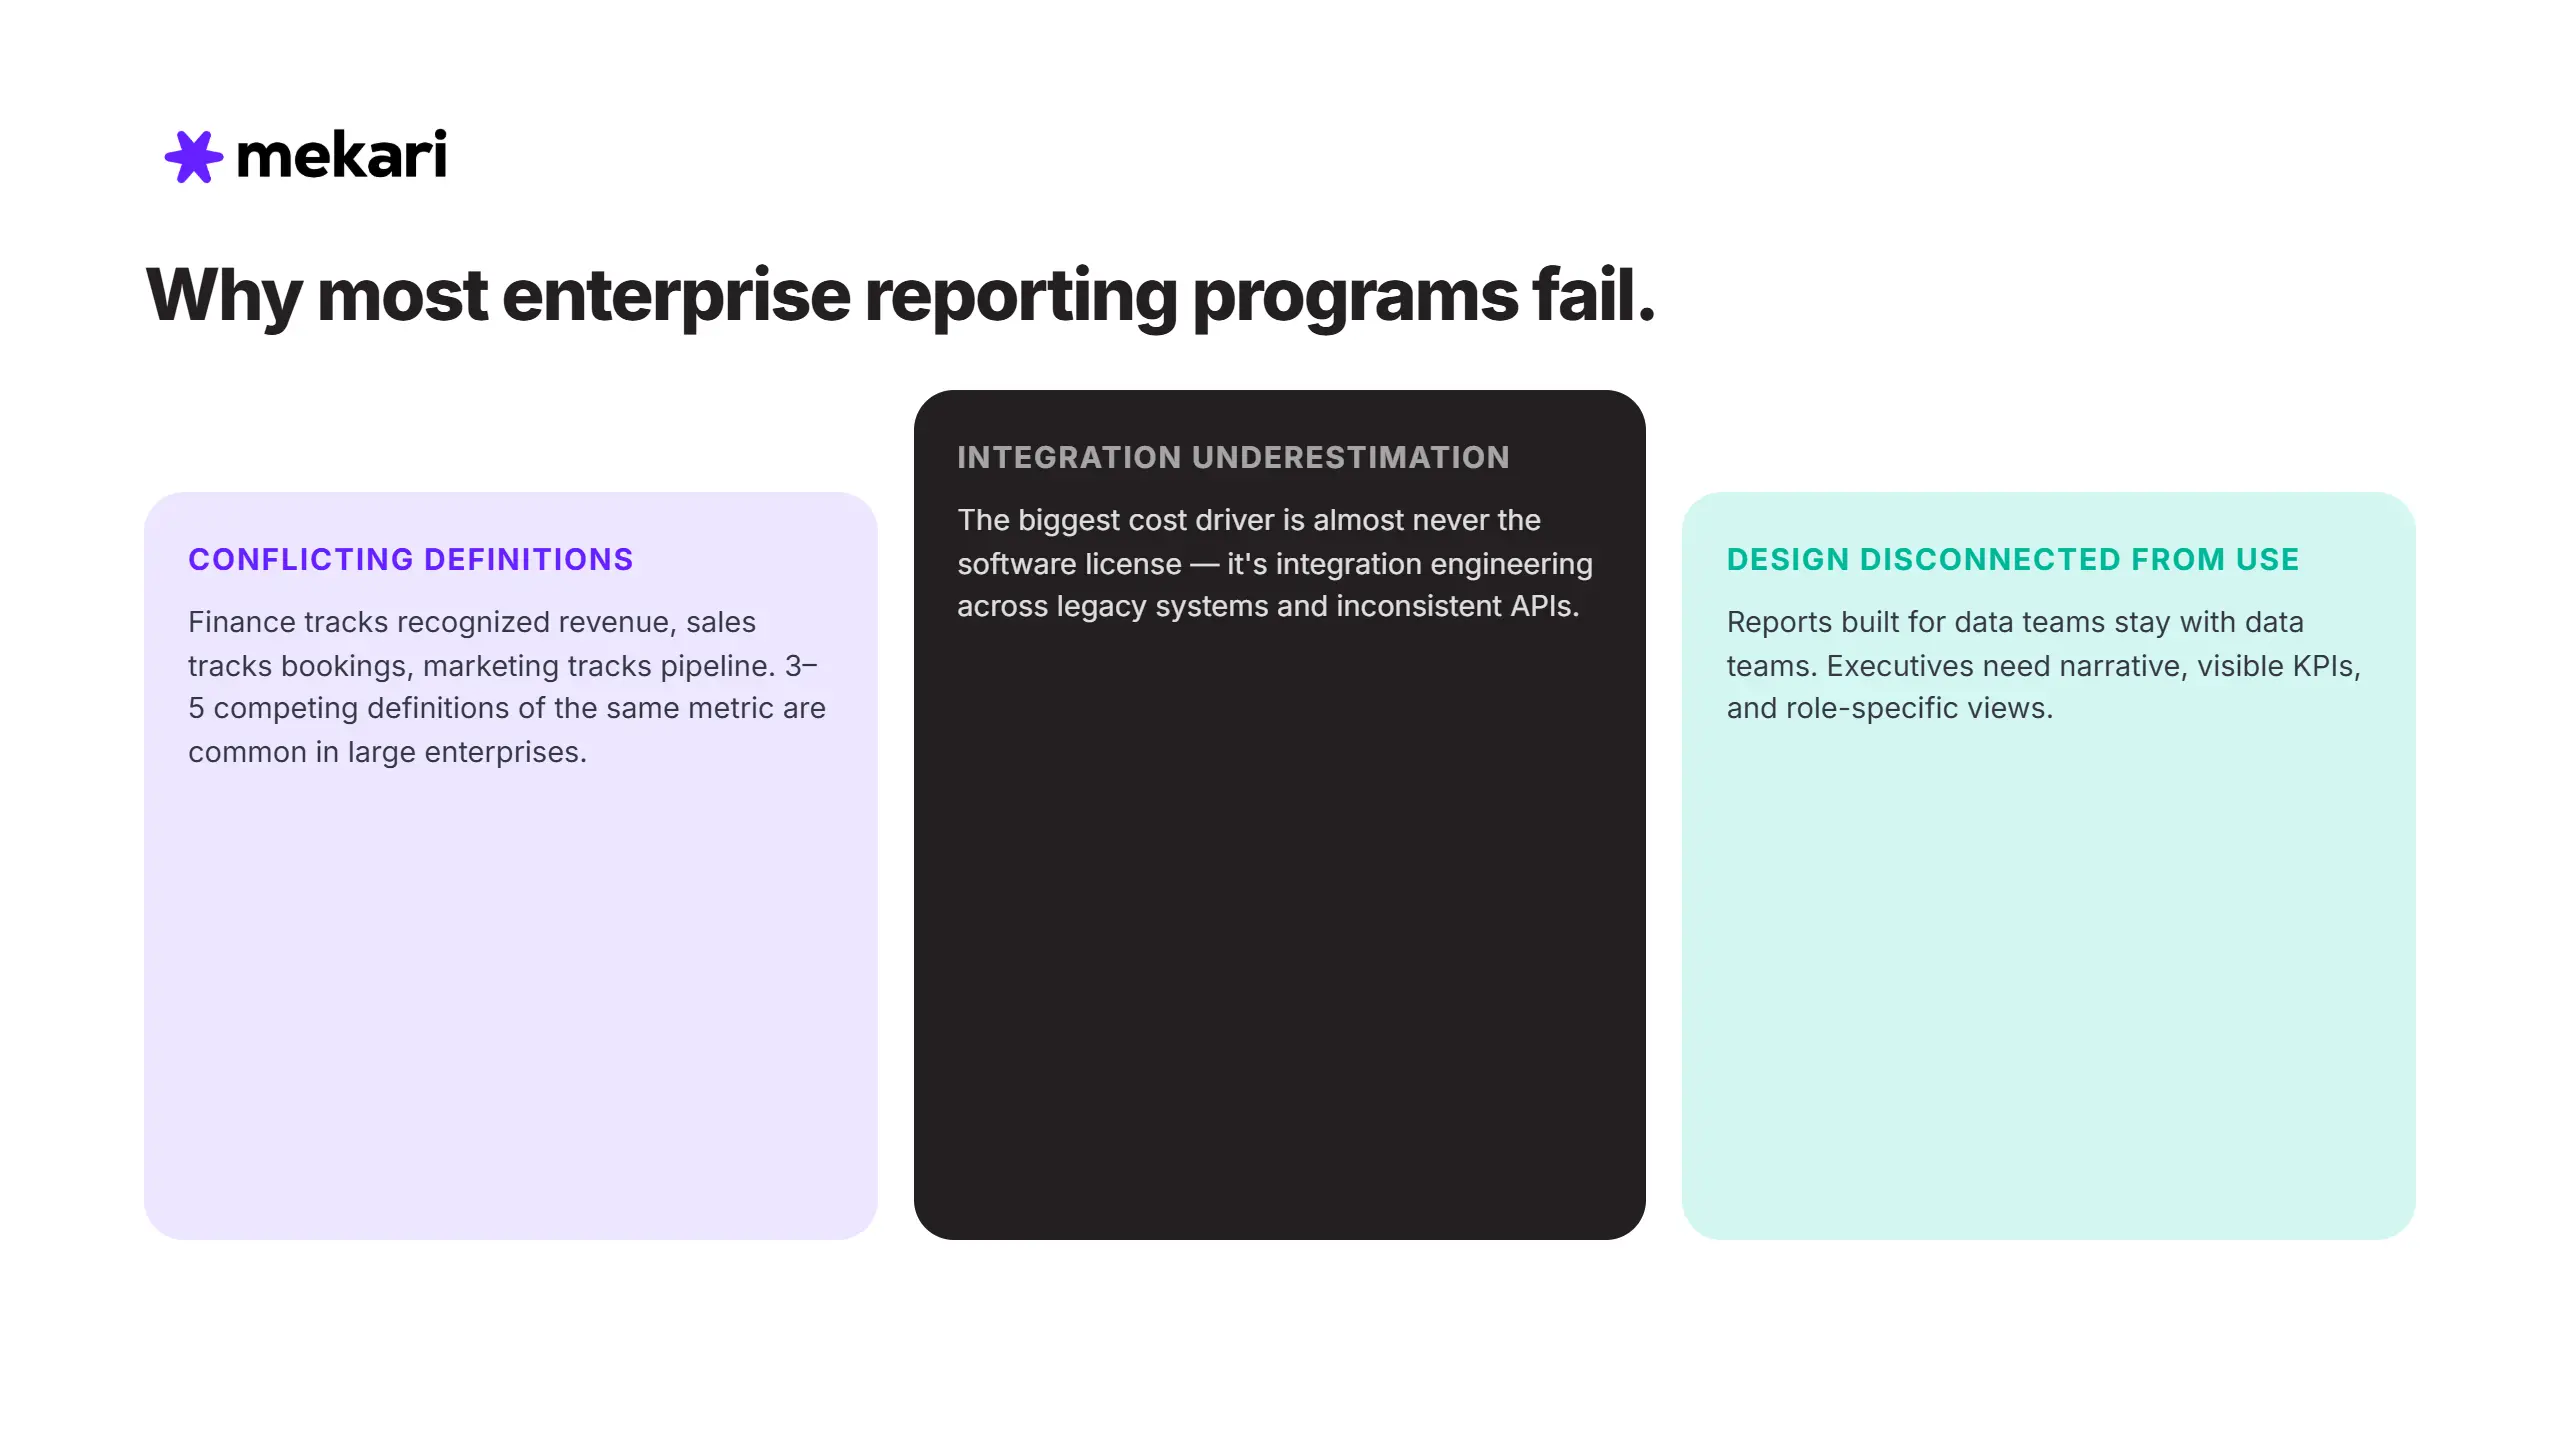
Three failure modes account for the majority of enterprise reporting programs that stall or collapse:
1. Conflicting metric definitions
Each function develops KPI definitions around its own operational priorities. Finance may track recognized revenue, Sales focuses on bookings, while Marketing measures pipeline value.
None is inherently incorrect, but they become incompatible when brought into an enterprise-wide reporting framework. Skipping metric governance and moving directly to platform selection only creates a more polished interface for the same underlying problem.
2. Integration underestimation
The most significant cost driver in enterprise reporting implementation is almost never the software license. It’s integration engineering.
Legacy systems, custom data models, and inconsistent API standards mean that connecting source systems to a unified reporting layer, such as an enterprise data platform, takes longer and costs more than planned.
Organizations that over-invest in the visualization layer and under-invest in data pipeline reliability make this mistake consistently.
3. Report design disconnected from executive use
A technically accurate dashboard still fails if nobody uses it to make decisions. Reports built primarily for data teams tend to remain within data teams.
Executive reporting needs a different design approach: a clear narrative, visible KPIs, role-specific views, and information that can be understood quickly. Effective report design is therefore as much about communication as it is about data.
A Practical Implementation Framework
Step 1: Secure co-sponsorship before selecting a platform
The CFO and CIO should act as co-sponsors, not simply approve the project. Finance establishes what needs to be reported and the business rationale behind it, while IT determines what can realistically be integrated, governed, and maintained.
When reporting initiatives begin within a single function, they often struggle to achieve the cross-functional alignment that enterprise reporting requires. Platform selection should come after this alignment, not before it.
Step 2: Build a metric inventory and governance model
Before creating dashboards, you should review and document the organization’s existing KPI definitions. Large enterprises often find three to five competing definitions of the same metric across departments.
Assign a business owner to each certified metric, document its calculation and time logic, and define a formal change-control process.
APQC benchmarking data indicates that top-quartile finance organizations treat metric governance as an ongoing quarterly practice rather than a one-time implementation activity.
The effort invested at this stage can significantly reduce downstream reconciliation work.
Step 3: Let integration requirements guide platform selection
The right platform should connect to the organization’s actual source systems, including ERP, HRIS, CRM, tax, and expense platforms, while enforcing governed metric definitions and delivering reports to the appropriate stakeholder groups.
If you are comparing options, this overview of enterprise software solutions can help you shortlist platforms against these requirements.
One common mistake is choosing a platform based on the quality of its demo or visualization capabilities, only to discover later that the underlying integration requirements were far more complex than expected.
Step 4: Design around board questions, not the data model
Executive dashboards should be designed around the decisions leaders need to make, rather than around every data point available in the underlying systems.
A well-designed executive dashboard should answer roughly 5 to 10 core strategic questions within seconds, instead of overwhelming leaders with every available metric.
The strongest enterprise reporting programs combine two disciplines: data governance, which ensures the numbers are accurate and consistent, and communication design, which ensures those numbers are easy to understand and act on.
A dashboard can be technically accurate and still deliver little business value if executives cannot quickly understand what the numbers mean or what action they require.
Build Enterprise Reporting Your Board Can Trust with Mekari
Enterprise reporting is ultimately a governance and integration challenge enabled by technology.
When different teams bring conflicting numbers into the boardroom, the problem is rarely the lack of data. It is fragmented systems, inconsistent definitions, and the absence of a trusted reporting foundation.
Mekari offers an integrated enterprise solution designed to bring business operations and data together in a more connected environment, helping organizations establish a more consistent foundation for reporting and decision-making.
With Mekari Airene, you can take this foundation further with AI-powered data analysis. Airene analyzes data within Mekari’s ecosystem to generate summaries, descriptive insights, and actionable recommendations, helping you gain insights from your data.
Learn more about Mekari for Enterprise and discover how Mekari Airene can support more connected, data-driven decision-making.

